Assessing air pollution inequalities with remote sensing instruments
A study over New York
Link to paper: https://pubs.acs.org/doi/10.1021/acs.est.2c02828
Introduction
An extremely important topic that still requires extensive research is the inequalities in environmental pollution across different societal groups. We see this phenomenon time and time again in cities around the world, where people of colour and low-income communities are exposed to higher rates of air pollution (or other types of pollution) than those outside of these groups. Understanding these inequalities is an important first step in mitigating them. How can remote sensing data help with quantifying these differences?
A research team aims to answer this question by quantifying inequalities in nitrogen dioxide exposure and emission sources across different census tracks across New York City, New York, and New Jersey. They focused their research on tract-level differences in race-ethnicities and household income. Their data were from the last 2018 U.S. Census. The period of study was from May 2018 to Sept 2021.
Data
This study used three remote sensing instruments: two airborne and one space-borne.
Airborne instruments:
Geostationary Coastal and Air Pollution Events (GEO-CAPE) Airborne Simulator (GCAS)
Geostationary Trace gas and Aerosol Sensor Optimization (GeoTASO)
Both of these are push-broom spectrometers that have a spatial resolution of 250 m x 250 m. They compared the column nitrogen dioxide measurements from these instruments with ground-based measurements of the same variables, with values within 25% of each other.
Spaceborne instrument: Tropospheric Ozone Monitoring Instrument (TROPOMI) has a spatial resolution of 7.5 by 3.5 km. When comparing the vertical column densities between GCAS, GeoTASO and TROPOMI, there was a high correlation between the two datasets.
Ground level Nitrogen Dioxide Concentration: These concentrations were taken from 11 stations across the city.
Emission data: They used a dataset called The Fuel Based Inventory of Vehicle Emissions (FIVE), which provides mobile source emissions data at a 4 km by 4 km resolution.
Methods
A high-level breakdown of the major components of the methods can be described as follows:
They create different categories using race and income metrics: low-income and non-white (LIN), and high-income and white (HIW)
The nitrogen dioxide measurements from the airborne instruments were averaged across each census tract for each flight within the study period and study area
The TROPOMI data are far too coarse for the census tracts (which are just over two square kilometres), so they oversampled it and averaged it across the study period to delineate tract-level differences.
Now, according to this study, the average census tract is just over two square kilometres, so the first question that we would as is how did they use TROPOMI data? They oversampled it and averaged it per census tract. The airborne instruments were used to compare the results, and there was a high correlation between the two types of measurement
They conducted a similar comparison between the FIVE emission data and the tract-level data
Major Takeaways
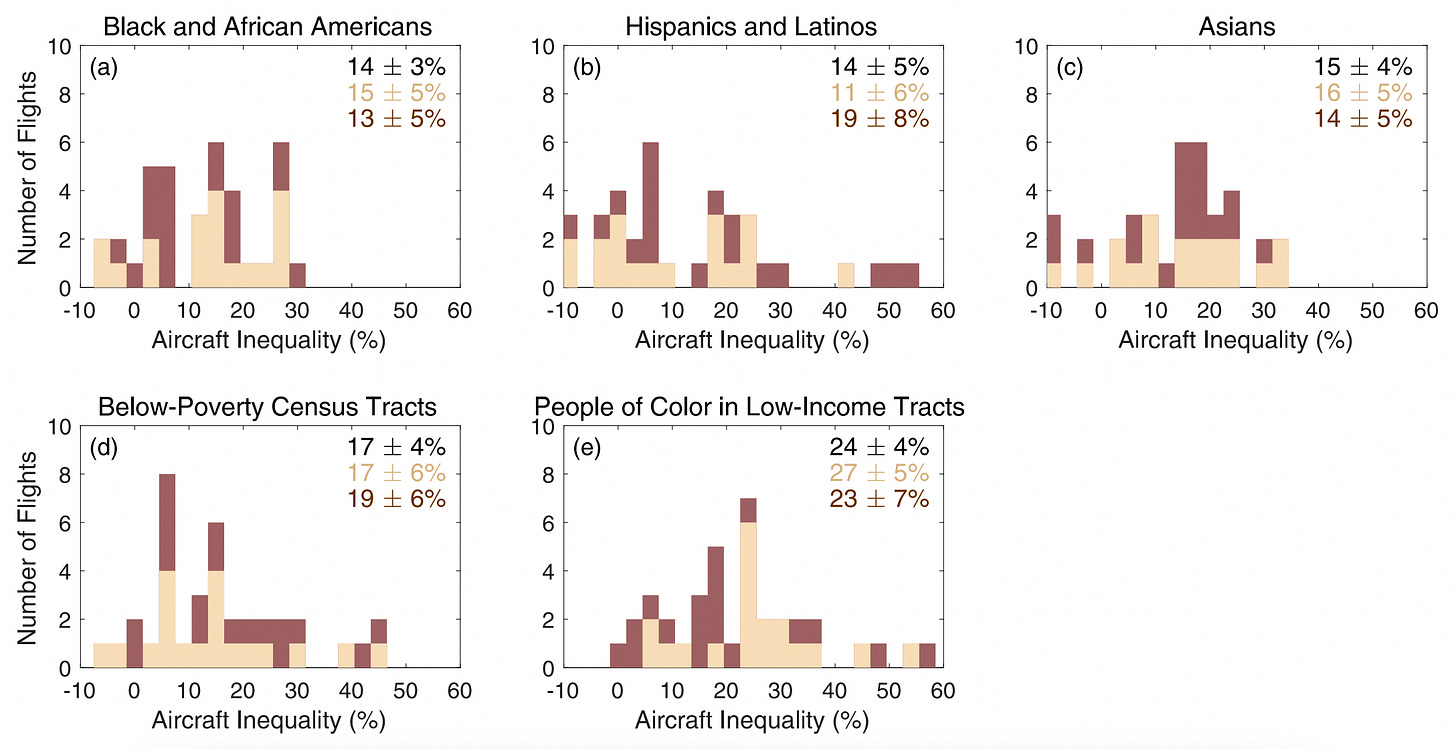
Nitrogen dioxide columns were higher in tracts below the poverty line than those above by 17%
Air pollution inequality will get worse with climate change
Inequalities vary more by day than by time of day
There is a 14% higher concentration of nitrogen dioxide in neighbourhoods that consist primarily of people of colour than those without.
Nitrogen dioxide concentrations were 24% higher in tracts with low-income and non-white than those in high-income and white neighbourhoods
Inequalities measured between TROPOMI and airborne instruments were highly correlated
Air pollution inequalities are higher in the winter season than summer season when looking at absolute values
Source
Dressel, I. M., Demetillo, M. A. G., Judd, L. M., Janz, S. J., Fields, K. P., Sun, K., Fiore, A. M., McDonald, B. C., & Pusede, S. E. (2022). Daily Satellite Observations of Nitrogen Dioxide Air Pollution Inequality in New York City, New York and Newark, New Jersey: Evaluation and Application. Environmental Science & Technology, 2. https://doi.org/10.1021/acs.est.2c02828

