Assessing livability in cities
A good read for urban planners and those who work in local government
Thanks for reading Earthbound! This publication is dedicated to providing subscribers with short summaries on the latest research in earth observation, techniques on how to use R and Python for data science, as well as simple breakdowns of spatial data science concepts. If you haven’t already, subscribe to learn more:
Happy new year!
Since it’s my first post of the new year, I wanted to review a paper on a health-focused research study. It was published in 2020 and is called “Assessing Community-Level Livability Using Combined Remote Sensing and Internet-Based Big Geospatial Data”
How can we use remote sensing data to understand the livability of our cities?
When I say liveability, I mean factors that play a role in living healthy, comfortable lives in the cities we reside in. How can remote sensing data be harnessed to improve urban planning techniques? This paper does a very good job of answering that question.
They focused on a city in China called “Linyi” and created a ranking system that harnesses satellite remote sensing and big data to understand which parts of this city have the highest and lowest livability scores. According to their paper, livability indexes are nothing new, and they can typically be grouped into three categories of scale:
Top-level, in which the livability score is compared between cities.
low-level: compare on a building-by-building scale
This paper focuses on the middle level, which compares neighbourhood blocks within cities and provides the most value for urban planners and municipal governments.
Zhu et al. (2020) also state that livability scores have been developed in the past using surveys using responses collected from residents. Although data from surveys are valuable, they are expensive to collect, especially with the volume of data needed to obtain a high-resolution understanding of neighbourhood livability.
And that’s why remote sensing data can play such a valuable role here. By creating a livability assessment, urban planners could understand which areas of their city require additional mitigation (for instance - more green space) or more points of interest (POIs). We can track urban land cover, thermal conditions, and air pollution.
There are multiple benefits to using remote-sensing data in livability assessments:
repeatable observation
wide-scale coverage
data availability
The interesting point to note here is that remote-sensing-based livability assessments can be updated much more easily than survey-based ones as cities continue to grow and advance.
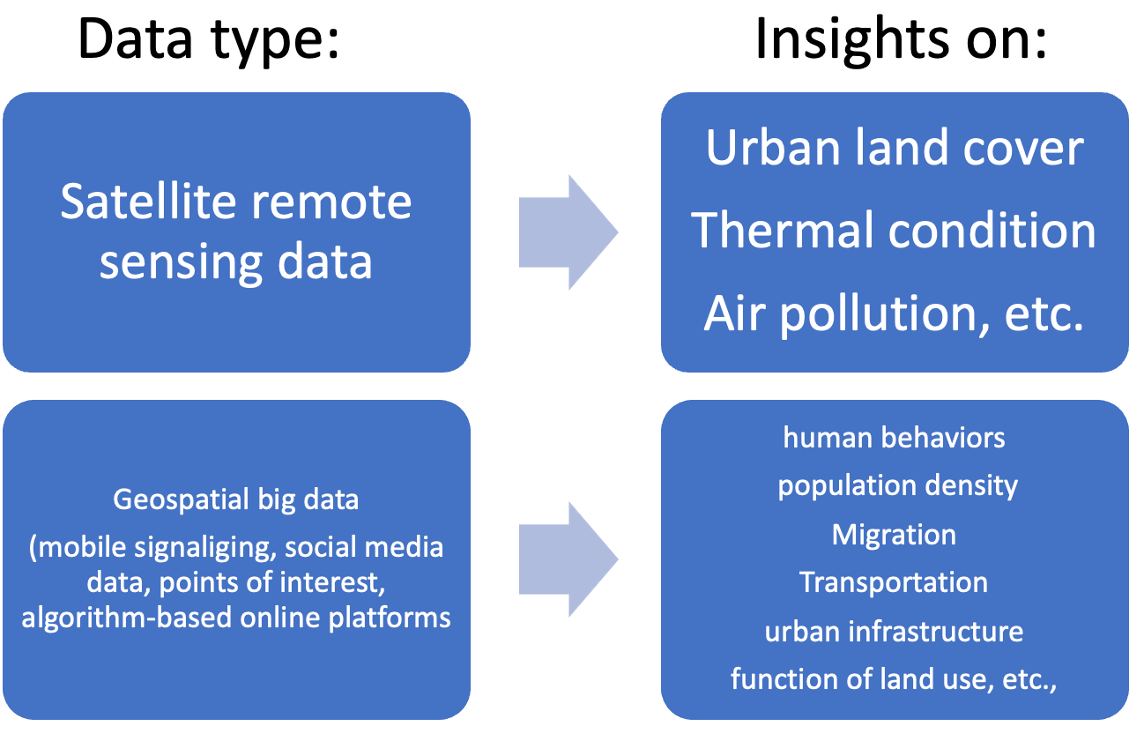
So what kind of data did they use? Well, the data types can be summarized into two groups, which I summarized in the following image:
These were the remote sensing products they used:
Sentinel-2A/B for the land use map
MODIS Version 6 from Terra and Aqua for the land surface temperature
MODIS for the PM2.5 concentrations of each community
Their analysis was broken down into three main stages:
Constructed a hierarchical index system for community livability
Derived the data of each index mainly from data sources
Calculated the livability scores using the weighted sum method and Monte Carlo simulations
Generated the spatial pattern of livability for the city
Results
After generating these livability assessments, they were able to gauge the following insights, which I found to be the most interesting part of this paper:
The thermal comfort across the city was influenced by their proximity to water bodies
Small-scale factories on the west side of the city had a strong influence on air quality and heat emissions
Communities in newly developed areas had the highest environmental comfort for the following reasons:
high green space
low building/population density
Older areas with a long history of urban development had better amenities
Communities within industries areas had the lowest livability zones
There was a strong correlation between livability and house price (the more expensive the house, the better the livability score).
These are incredibly valuable insights for any municipal body to consider when growing their city. However, every research study has it’s limitations. The authors of this paper acknowledge that these assessments are based on their index system for livability and that it’s critical to validate these studies with resident surveys. I think this was a great example of the power of satellite remote sensing data (and big data), and I hope that more communities around the world build out similar assessments to create more informed decisions on urban planning.
That brings me to the end of my post - thanks for reading! If you have any questions about remote sensing and the role it can play in your workflow, feel free to reach out on our official Twitter page!


