Cool EO Research: April 5th edition
Measuring blue carbon, BEAVERS, and our ability to measure time.
This is the second weekly update on interesting earth observation research. In this week’s issue, we look at three studies:
Estimating blue carbon stocks
Tracking beaver ponds across 37 years
Global warming is impacting timekeeping
Pretty cool huh? If you want more updates on the latest earth observation research (covering both open and paywalled research), feel free to click the subscribe button:
We are a reader-supported newsletter, so if you’re REALLY enjoying them, and want the full issue weekly (as well as more detailed articles on single papers), please consider becoming a paid subscriber.
Estimating blue carbon using remote sensing
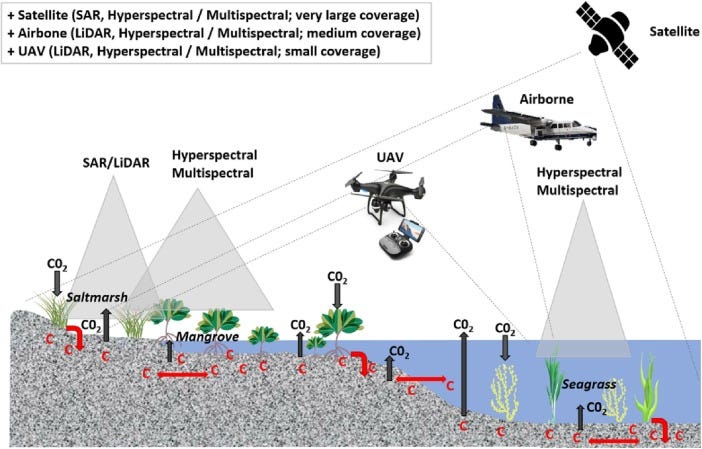
Blue carbon ecosystems are important for climate change mitigation. What is blue carbon? Blue carbon is defined as “any carbon stored by the ocean.” However, in this study, the researcher examine coastal blue carbon, which is the amount of carbon stored in coastal ecosystems, which include mangroves, seagrasses and salt marshes. These environments sequester a significant amount of carbon within their biomass and this paper reviews the EO tools and modelling methods that can be (or have been) used to quantify the amount of blue carbon in these important ecosystems.
The most common sensors used in blue carbon assessments have been from Landsat, although more recent studies have started to use Sentinel.
The models are validated using in-situ measurements of biomass.
The remote sensing approaches are then summarized and include spaceborne, airborne and UAV sensors.
Spaceborne instruments have been used to measure leaf chlorophyll, leaf area index, NDVI, etc.
The downside to using multispectral data is the extensive cloud clover and daytime operations
Hyperspectral data are more accurate than multispectral at assessing the above variables.
Airborne sensors collected both LiDAR data and SAR data. These data have been used for creating shoreline maps, digital elevation models, land cover modelling, mangrove species classification, and more
UAV sensors are the most effective for assessing biomass in single-height forests
Using EO to track beavers
This is my paper of the week because it’s all about nature’s engineer - beavers! Beavers dams can have a widespread impact on ponds, hydrology, and ecosystems. They can create wetlands and ponds. Can EO track their impact? Let’s find out!
Satellite remote sensing was used to track beaver ponding changes in Manitoba Canada. This study was for a multi-decade time period.
They used a 30-meter Landsat to map out water bodies and 0.5-meter WorldView images (available on ArcGIS Pro) to manually identify beaver dams
The beaver dam database was used to delineate water bodies that were controlled by beaver engineering (so cute!)
Landsat NDVI was used to assess beaver forage ability, and the Landsat water surface product was used for assessing precipitation and background wetness
Then, they mapped out 37 years’ worth of beaver ponding dynamics.
The degree of beaver ponding decreased by 80% from 1986 to 1995, but it returned to initial levels by 2015 and has since been stable.
Global warming is impacting timekeeping
This paper was super interesting, and it taught me a lot about how we keep track of time globally. Coordinated Universal Time (also known as UTC time) closely follows the earth's rotation. However, this rotation isn’t constant, so our computer networks and timekeeping systems have to include “leap seconds” in order to account for this inconsistency.
At some point, we were required to include ‘negative leap seconds” into our computing systems. According to the paper, this will create “unprecedented problems” to our timekeeping systems.
However, this switch to negative leap seconds has been delayed by global warming.
Global warming has increased the rate of ice melting across Greenland and Antarctica.
This melting has decreased the angular velocity of the earth, and consequently, our timekeeping efforts
The negative leap seconds will now be included around 2029.
This is actually three years later than planned, which is due to the aforementioned ice melting.
What role does satellite data play in this?
Satellite measurements were used to measure the “spherical harmonic expansion.” Satellite laser ranging is used to measure the mass change of the earth, which allows the research team to measure the aforementioned spherical harmonic expansion.
That’s it for this week, thanks for reading! If someone shared this post with you, and you want to continue receiving more, here’s a button to subscribe:
As usual, I’ll be doing a deep dive into one of these papers for my paid subscribers, so let me know which ones you’d like to see!
And finally, here’s a cute picture of a beaver to end your week:


