Cool EO research: March 29th, 2024
Environmental impact of EO data, a digital twin of our water cycle, and understanding floods
I will start a regular series of posts on the latest earth observation research. I’m not yet sure how often they will be released. These posts will include an overview of interesting earth-observation-based papers that I’ve come across. I hope this will be an easy way to expose yourself to different types of research. I’m also going into a deep dive into one of these papers, so if you find any of them particularly interesting, let me know.
This week we look at:
The environmental impacts of EO data
A digital twin of our water cycle
Assessing crop production loss in Pakistan in 2022
Environmental impacts of earth observation data in the constellation and cloud computing era
What’s the environmental impact of collecting, processing and using all of the earth observation data? These are the takeaways from the paper.
They look at the environmental impacts of three segments: ground, space, and data. The image below is a good breakdown of each segment.
Computing EO function on the cloud can be three times more energy intensive than local computing (approximately)
Data duplication across different platforms (like AWS, Google Earth Engine and Microsoft Planetary Computer) is a big contributor to the energy consumption of earth observation data. Reducing data redundancy is key to reducing energy consumption. I have no idea how this is feasible across the big corporate players - wouldn’t they all want all of the data?
Current data centers contribute approximately 0.3% to overall carbon emissions.
The location of the cloud computing data centers heavily influences the degree of environmental impact.
A digital twin of our water cycle
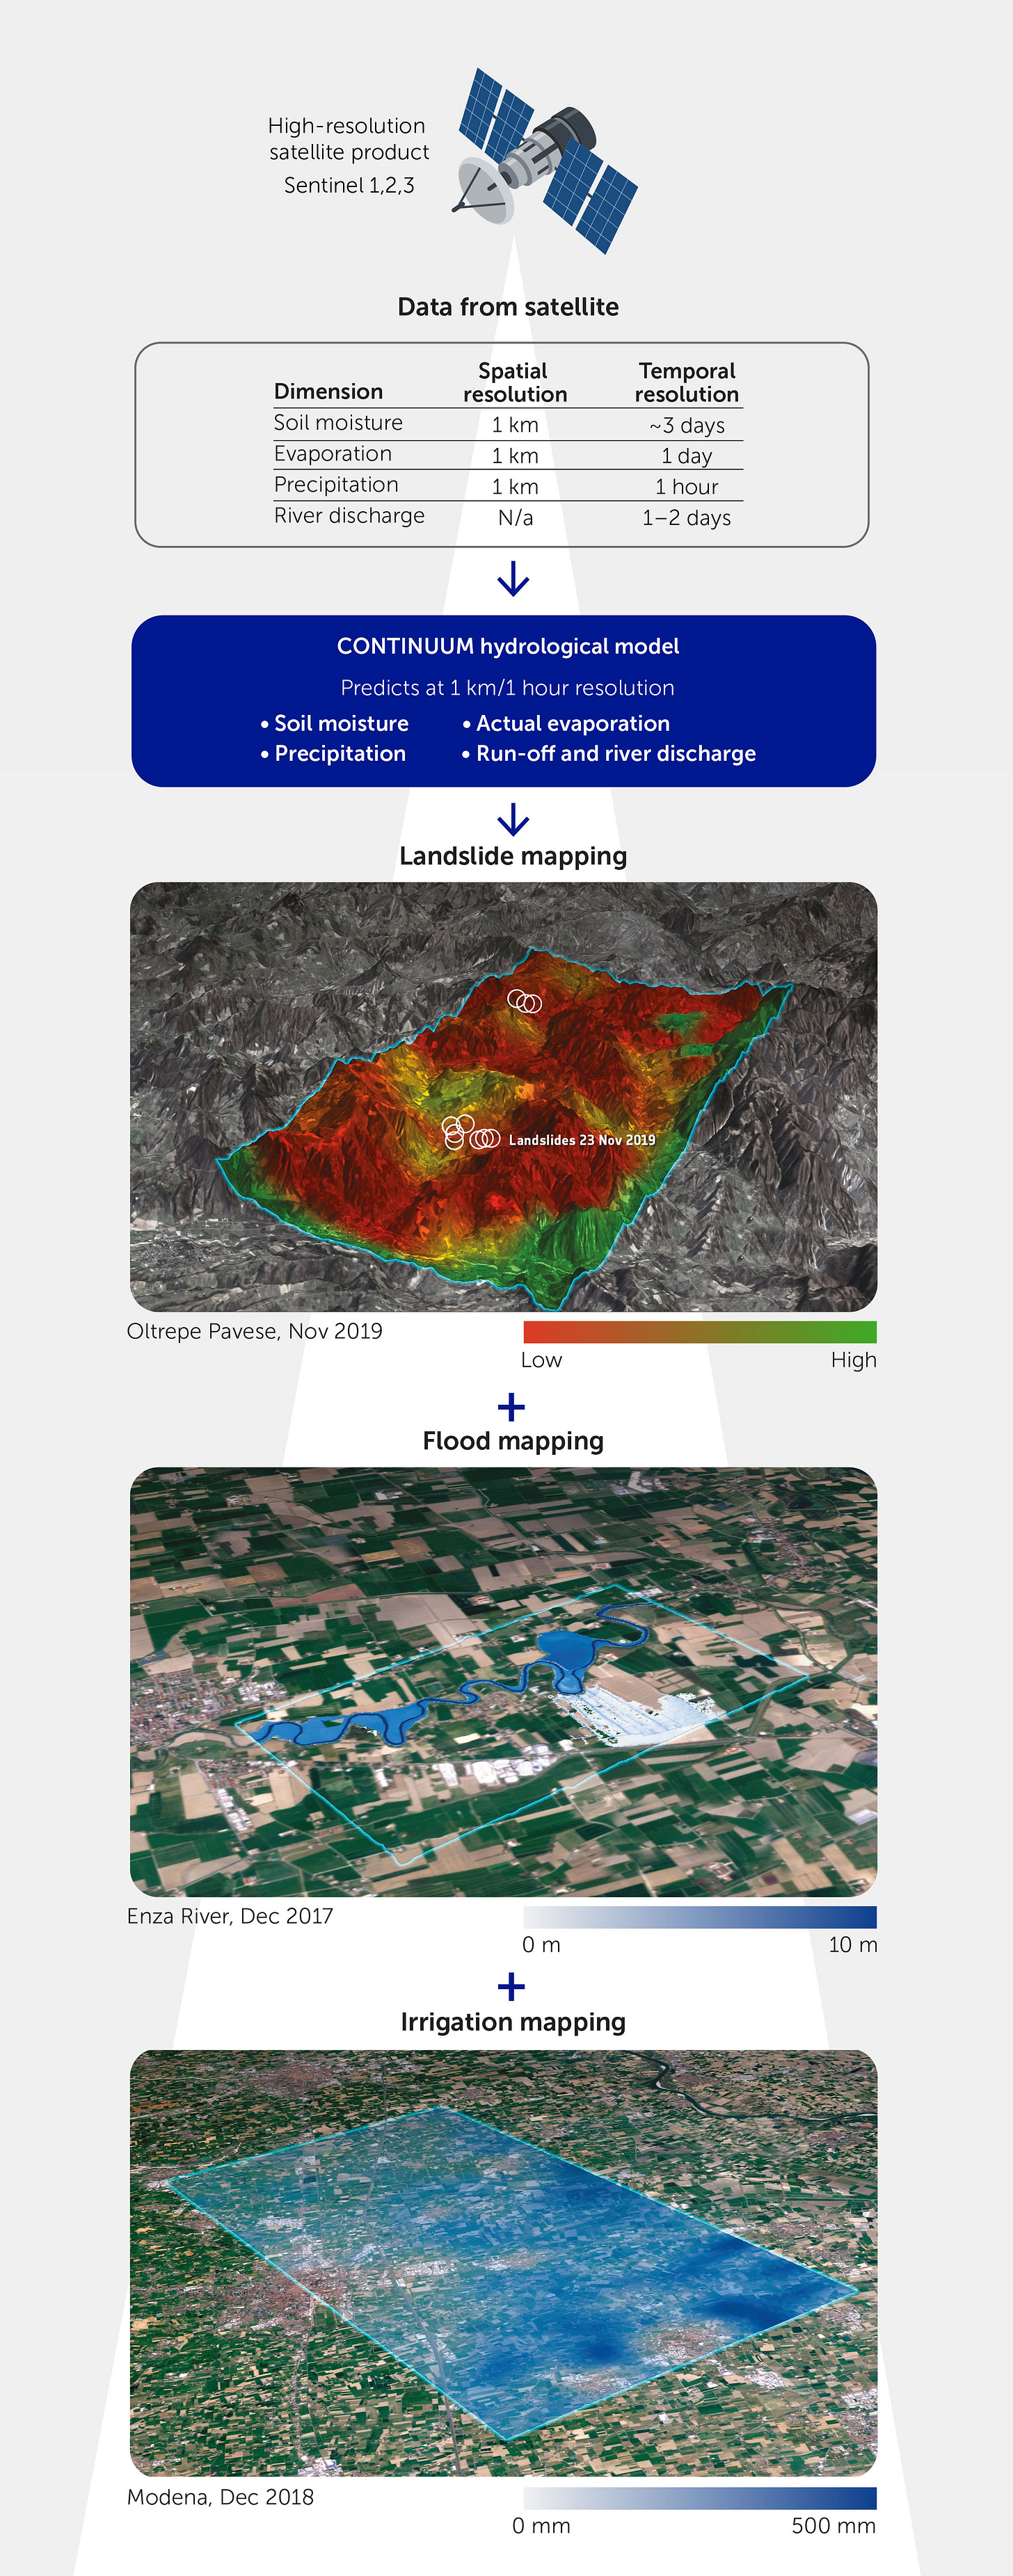
This paper outlines how they build a 4-dimensional digital twin of our water cycle. There are three space dimensions and one time dimension.
A digital twin of the global water cycle is created at a 1 km spatial resolution and a 1-hour temporal resolution. With most of the current hydrological and land surface models, a challenge is accounting for the impact of human behaviour.
They fused data from hydrological models and satellite observations.
The data cube consists of soil moisture, precipitation, evaporation and river discharge.
This model will be used for landslide prediction, simulation of floods and irrigation
Assessing crop production loss in Pakistan during the 2022 floods
Pakistan had widespread flooding in 2022. An estimated 33 million people were impacted by this disaster.
To assess the impact of these floods on crops, data from Sentinel and GPM were used.
Sentinel-1 was used for flood extent mapping
Sentinel-2 (specifically NDVI) was used to map out crop cover
GPM was used for rainfall intensity measurements
The results of the study demonstrate that 57% of the cropland in Sindh (a province in Pakistan on which the study was focused) was damaged.
This entire analysis was done in Google Earth Engine.


