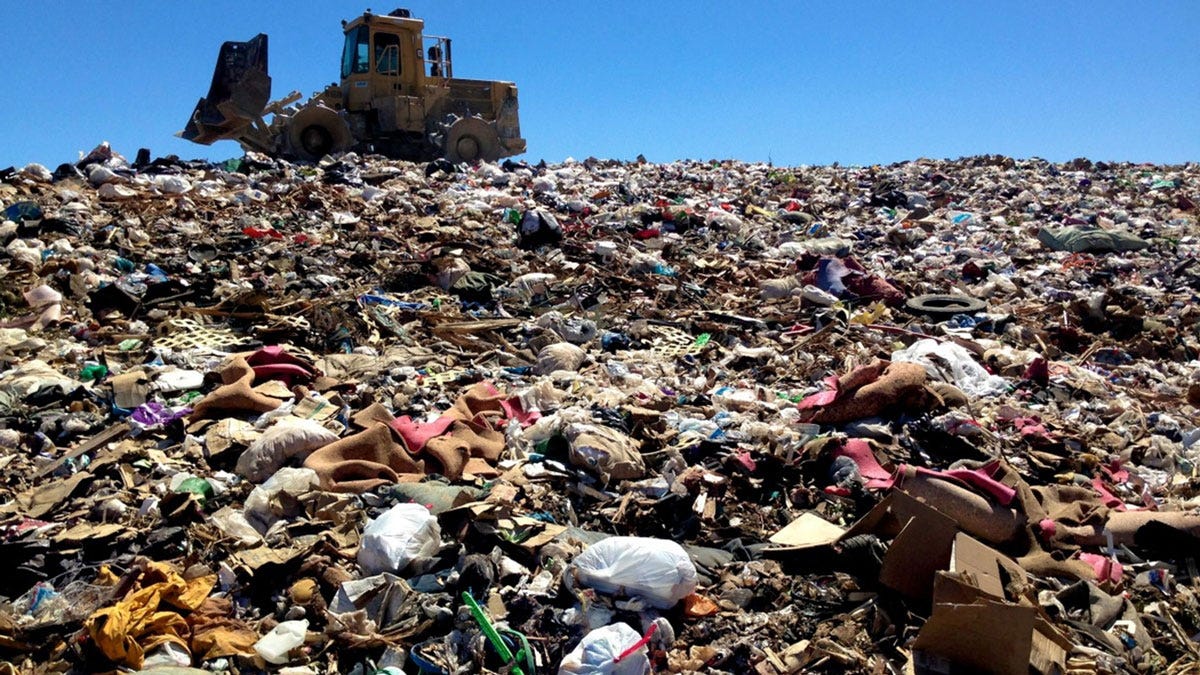
How do we measure methane from landfills?
Satellite data can improve existing methods to quantify methane.
Welcome to Earthbound! In this blog, we look at the latest climate-focused research, focusing on work that harnesses satellite remote sensing data.
Let’s talk trash.
In this post, we look at a research study that measured methane over landfills in California using data from a hyperspectral instrument called “AVIRIS.” This stands for Airborne Visible / Infrared Imaging Spectrometer. AVIRIS is a hyperspectral imaging spectrometer that has a spectral range of 380 to 2510 nm. This instrument has been flown primarily over the United States, with a few flights above Canada and Europe.
In this study, AVIRIS was flown over multiple landfills in California and then used to quantify the methane emissions over each site. The interesting thing about this study is that they break up the paper into three distinct use cases for quantifying methane, which is the following:
Identify strong points sources from landfills
Identify emissions from changes in landfill infrastructure
Identify emissions from organic waste plants - this one is particularly interesting because the organic waste plants were used to MITIGATE methane emissions, but ended up becoming another methane source on their own!
Link to paper: https://iopscience.iop.org/article/10.1088/1748-9326/ab7b99
This type of research is particularly important because landfill operators in the US are required to quantify methane emissions from their sites as part of the EPA’s Greenhouse Gas Reporting Program. The problem here is that the current model used to quantify these emissions (called LANDGEM) does not account for parameters that impact methane emissions, including the following:
operations
meteorology
topography
landfill infrastructure
So it’s a lot more simplified and underreports actual methane emissions (in some cases it has shown to be 80% lower than actual emissions).
The other issue with using the LANDGEM is that the landfill layout changes constantly, and frequent measurements are important. Emissions can be influenced by landcover type, thickness and material heterogeneity. Currently, landfill emissions make up around 18% of the country's methane emissions.
The use case for satellite data is extremely clear here.
What’s even more interesting is that they found (through the AVIRIS data) that methane emissions from landfill sites across California contributed just over 41% of methane emissions for the state! With all the upcoming instruments, maybe monitoring landfills with EO data will become more common.
So how exactly did they quantify methane using the AVIRIS data? The data used were between the 2215 - 2415 nm range. AVIRIS has a meter scale resolution, enabling a very precise estimate of emissions directly over the landfill site. They used this data to identify plume masks.
A plume mask in the context of this study was defined as an isolated area with a high methane concentration.
After identifying the spatial extent of the methane plume, they calculated the integrated mass enhancement (IME) to quantify the methane demonstrated by the emission source (i.e. the landfill). I’ll write a more specific blog post on how this calculation works later this week.
What were the findings of each use case?
Identify strong points sources from landfills
The emissions were highest from the active face of the landfill site (i.e. the area where incoming waste is being deposited).
Emissions from this active face were up to 21% of the methane emissions from the site.
The analysis from the AVIRIS data was 2-3 higher than the LANDGEM model
Identify emissions from changes in landfill infrastructure
They identified a ‘massive’ methane plume over a landfill site
It turns out that this methane plume was a side effect of a mitigation tactic the landfill operators had implemented to reduce odour (they had been ongoing complaints).
After implementing alternative landfill odour mitigation strategies, the odour and methane emissions both decreased, as demonstrated in this image.
Identify emissions from organic waste plants
This was the most interesting part of the paper.
So anaerobic digestion and composting facilities are often implemented to reduce methane emissions by diverting organic material
By doing this, they don’t need to report methane emissions from those facilities, and they would be unaccounted for in any carbon accounting exercise.
In this study, they found significant methane plumes from both types of facilities
This is problematic because these are unreported values
Composting is encouraged to reduce GHGs in the state. Studies like this demonstrate that these additional facilities should also be monitored for methane to understand its efficacy.
Here’s what the plume looked like:
Source:
Foster, K. T., & Miller, C. E. (2020). Using remote sensing to detect, validate, and quantify methane emissions from California solid waste operations. Environmental Research Letters, 15(5), 054012. https://doi.org/10.1088/1748-9326/ab7b99
Thanks for reading. If you enjoyed this article, feel free to share it with others.
We post articles twice a week on Earthbound. If you want to remain up to date with the latest earth observation research, click the subscribe button!


